If you've ever felt like your Jira projects are a chaotic jumble of issues and epics, you're definitely not alone. Many teams hit a wall where Jira’s flat lists just don’t cut it anymore. This is exactly where Structure for Jira, a powerful app from the Atlassian Marketplace, comes into play.
Think of it as the missing architectural blueprint for your projects. It takes all of Jira's raw materials—tasks, stories, and epics—and lets you organise them into clear, multi-level hierarchies that actually make sense for your team.
Untangling Jira Complexity with Structure
Jira is fantastic at tracking individual pieces of work. No one denies that. But as projects grow and initiatives span multiple teams or departments, its native hierarchy can feel restrictive. You get stuck with a rigid epic-story-subtask model that doesn't always reflect how work really gets done.
Soon enough, teams find themselves trying to track progress across dozens of epics or understand dependencies between different projects, and they just can't see the forest for the trees. It’s this exact scaling problem that Structure was built to solve.
It works by adding a flexible layer on top of your existing Jira data. You can build dynamic, spreadsheet-like views that can be tailored for any audience, from developers to executives. Instead of being locked into Jira’s default setup, you’re free to create your own logical groupings based on what matters most.
This kind of organisational power is critical for large-scale operations. It’s no surprise that tools providing such clarity are popular in major markets. For instance, in Germany, Atlassian's revenue recently hit an impressive $539.55 million, a figure that highlights just how much agile teams rely on well-structured workflows. You can dig deeper into the German software distribution market on futuremarketinsights.com.
Visualising the Bigger Picture
At its heart, Structure for Jira is all about bringing clarity to complexity. It allows different stakeholders to look at the exact same project data but through a lens that’s meaningful to them.
For example, a project manager can get a high-level overview, while an engineer can zoom into their specific tasks, all within the same view.
What this screenshot shows is how managers can instantly see progress roll up from individual tasks to entire epics. Those little progress bars give you an at-a-glance status update without having to click into a dozen different issues.
The real magic of Structure is that it creates a single source of truth. It takes what can feel like chaotic data and turns it into real, actionable insight. Suddenly, you can visualise progress, manage resources, and track dependencies in ways that go far beyond what Jira offers out of the box.
By giving you the tools to organise Jira issues into a meaningful hierarchy, Structure helps your teams finally move from a state of confusion to one of control. You can start making informed decisions based on a complete and accurate picture of everything that's going on.
Building Your First Hierarchy From Scratch
Diving into Structure for Jira for the first time is a bit like getting a fresh set of LEGOs. To really start building, you need to get familiar with the three key components that make it all work: Structures, Generators, and Transformations. Think of these as your basic toolset for organising any project view you can dream up.
A Structure is essentially the canvas or workspace where you build your hierarchy. You can start one by simply dragging and dropping Jira issues into place, but the real power lies in letting the tool do the heavy lifting for you.
That’s where Generators come into play. These are just automated rules that pull in your Jira issues and arrange them according to your logic. A classic example is the "Stories under Epics" generator, which automatically finds all the stories in a project and tucks them neatly under their parent epic. No more manual linking.
This flowchart shows how Structure can turn a jumble of Jira data into a clear, organised overview.
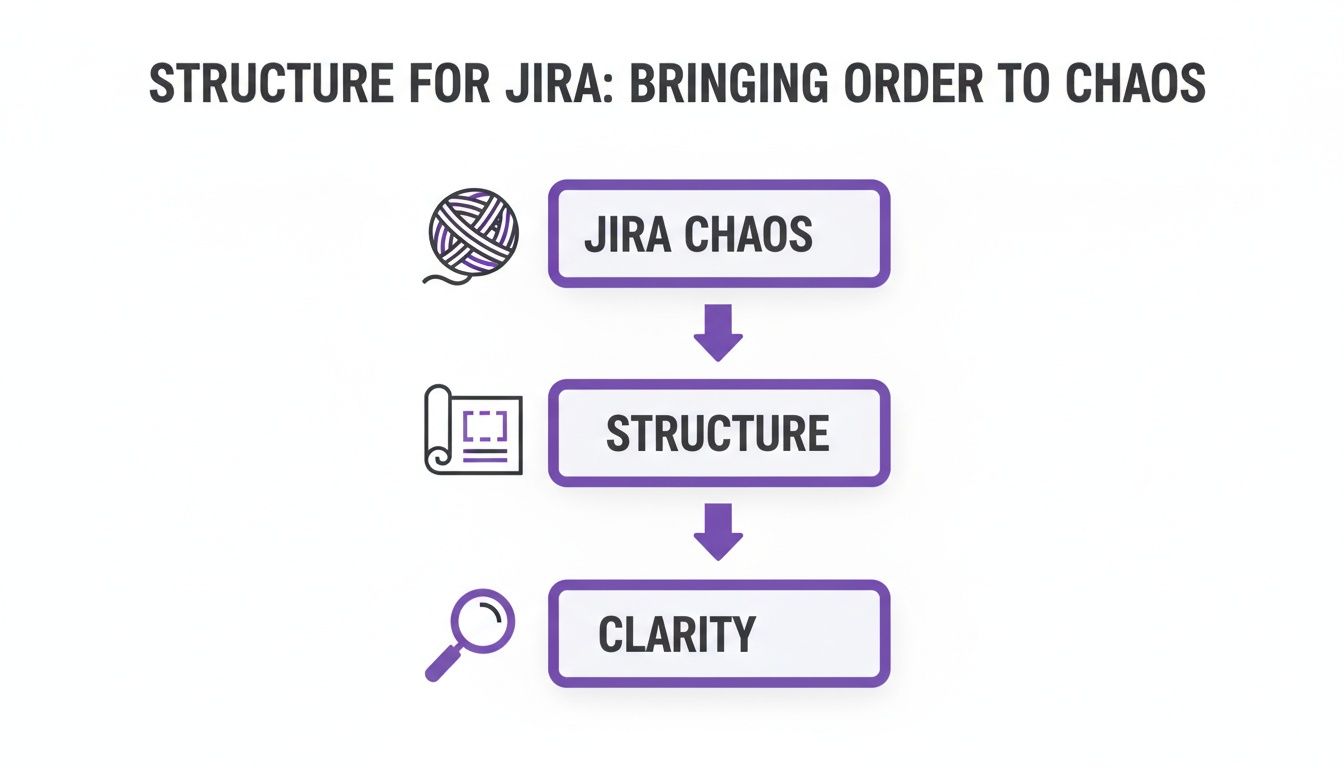
As the diagram shows, it’s a clear path from the typical chaos of raw Jira data to an actionable project blueprint that brings genuine clarity to everyone involved.
Putting It All Together in Practice
So, let's walk through creating a simple structure for a product launch. Imagine your team has a big epic called "Q3 Product Launch," which has dozens of stories and sub-tasks branching off it.
- Create a New Structure: First up, create a blank structure and give it a sensible name, like "Product Launch Dashboard."
- Add Your Starting Point: Find and add the "Q3 Product Launch" epic to your structure. This will serve as the top-level anchor for everything else.
- Automate with a Generator: Now for the fun part. Add a generator to do the work. You could use an "Insert" generator with a JQL query like
parentEpic = "Q3-LAUNCH-123"to pull in every related story automatically. - Go a Level Deeper: To get even more granular, you can chain another generator to fetch all the sub-tasks and place them under their parent stories.
And just like that, you've built a dynamic, multi-level view of your entire launch. This isn't just a static report; it's a living hierarchy that updates in real-time as your team logs their work in Jira.
The key thing to remember is this: Generators build the hierarchy, while Transformations let you look at that same hierarchy through different lenses. You build it once, then pivot your view whenever you need to.
Introducing Transformations
Last but not least, we have Transformations. These let you slice and dice your data without changing the core hierarchy you built with your generators. It’s like putting different filters or sorting layers over your view.
For our product launch example, you could apply a transformation to:
- Group by Assignee: Instantly see who's working on what and spot if someone is overloaded.
- Sort by Due Date: Quickly find which deadlines are looming and get ahead of any potential delays.
- Filter by Status: Zero in on only the tasks that are 'In Progress' or 'Blocked' to better manage the day's work.
It's this powerful combination of a solid foundation (built with generators) and flexible views (applied with transformations) that makes Structure for Jira such an effective tool. You’re no longer locked into one rigid way of looking at your projects.
Beyond Basic Hierarchies: Advanced Views and Metrics
Once you get the hang of building basic hierarchies, you can really start to see why Structure for Jira is such a powerful tool. It’s in the advanced features that the app shifts from a simple organisational aid into a full-blown project intelligence engine. This is where you can create dynamic, data-rich views that answer tricky business questions on the spot.
A perfect example is dynamic grouping and sorting. Let's say you've got a classic work-breakdown-structure showing your epics and their child stories. With just a couple of clicks, you can instantly regroup all those same issues by assignee, sprint, or even priority. You're pivoting the data on the fly, moving from a project-focused view to a team-focused one without having to build a single new report.

This ability to reshape your data is a game-changer for catering to different audiences. A project manager might live in the work-breakdown view, while a team lead needs to see who’s working on what for the current sprint. Structure lets them both get what they need from the same source of truth.
Custom Calculations with Formula Columns
One of the most powerful tools in Structure's arsenal is the formula column. Think of it as embedding a little piece of a spreadsheet right into your Jira view. These columns let you run calculations across your entire hierarchy, which is perfect for creating custom Key Performance Indicators (KPIs) and progress roll-ups that Jira can't handle out of the box.
For instance, you could easily set up formulas to:
- Calculate Total Story Points: Automatically sum up all the story points from the tasks and stories nested under an epic to see the total estimated effort.
- Track Budget vs. Actuals: If you store cost estimates in a custom field, a formula can roll up the actual time logged against that budget, showing you the variance in real-time.
- Measure Progress Percentage: Go beyond a simple "To Do" or "Done." You can create a progress bar that calculates the percentage of completion based on the status of all the underlying tasks.
These custom metrics turn a flat list of issues into a living, breathing project dashboard. This level of customisation helps explain why such tools are gaining traction in robust markets like Germany, where the software distribution market is forecast to grow at a 13.8% CAGR from 2025 to 2035. Much of this growth is fuelled by cloud adoption (64.3% of deployments), as businesses demand more scalable project management tools. You can explore more about Jira's market share and usage statistics to see the broader trend.
Visualising Cross-Project Dependencies
Anyone who has managed a large programme of work knows the headache of tracking dependencies between issues that live in different Jira projects. It's a massive blind spot in native Jira, especially for portfolio managers or organisations where specialised teams work on interconnected parts of a bigger product.
Structure for Jira solves this problem beautifully. You can pull issues from dozens of different projects into a single, unified view. From there, you can use issue links to clearly visualise how everything connects, seeing exactly how a delay in one team's project will cascade and impact another's timeline.
This cross-project visibility is absolutely critical for effective portfolio and resource planning. It helps managers spot potential bottlenecks long before they become five-alarm fires, keeping interdependent teams aligned and on track. When you pair this with Structure.Gantt, the picture becomes even clearer, mapping out all those dependencies on a visual timeline. By tapping into these advanced features, teams can gain a level of control and insight that just isn't possible with Jira alone.
Practical Blueprints for Common Use Cases
Theory is great, but the real magic of Structure for Jira happens when you apply it to solve real-world problems. Instead of staring at a blank screen, you can use proven templates—or as I like to call them, blueprints—to build incredibly insightful views right away. Think of these as practical recipes, using specific generators and transformations to meet common organisational needs.
Let's walk through three battle-tested blueprints you can steal and adapt for your own teams. Each one tackles a specific challenge, from managing large-scale agile programmes to giving executives the high-level reports they crave. Once you get the logic behind them, you'll be building powerful visualisations in no time.
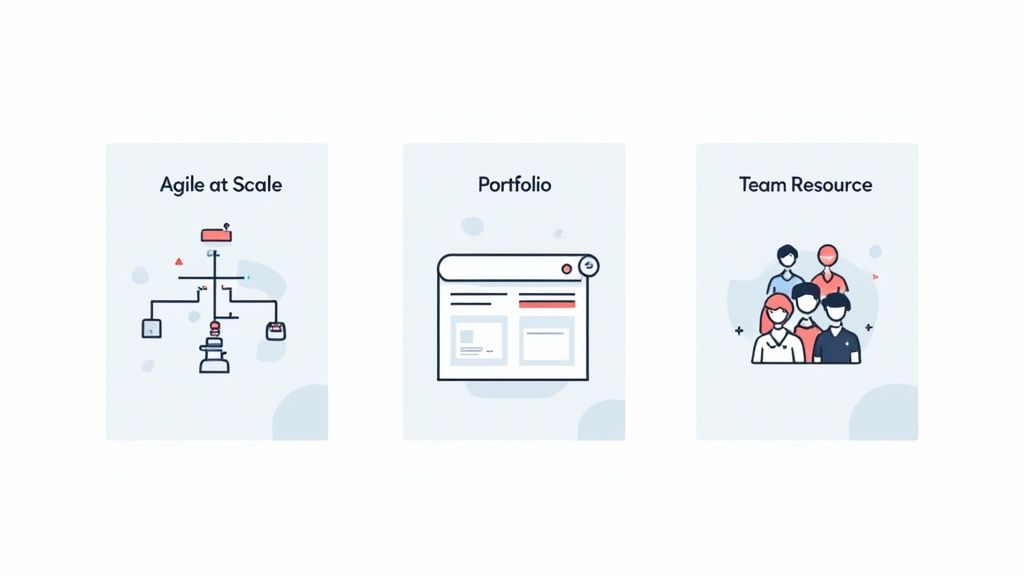
Agile at Scale Blueprint
If your organisation uses a framework like SAFe, you know how crucial it is to see the entire work hierarchy, from the highest-level strategy down to the tiniest sub-task. This blueprint does exactly that, creating a multi-level view that connects portfolio epics all the way down to the stories development teams are working on.
The whole point here is complete top-to-bottom traceability. You can literally watch how a strategic theme breaks down into features, and then see how those features are delivered through user stories in specific sprints. It makes progress crystal clear and keeps everyone pulling in the same direction.
Here’s how you build it:
- Insert Generator: Start by pulling in your top-level issues with a JQL query, something like
issuetype = "Portfolio Epic". - Extend with Linked Issues: Next, add an "Extend with Linked Issues" generator. This will find all the child issues, like Features or standard Epics, that live under those portfolio epics.
- Extend with Stories: Chain on another generator, either "Extend with Linked Issues" or the specialised "Stories under Epics," to pull in all the user stories.
- Extend with Sub-tasks: Finally, add one more generator to bring in all the sub-tasks, nesting them neatly under their parent stories.
What you're left with is a clean, nested hierarchy that perfectly mirrors your agile framework.
Project Portfolio Management Blueprint
Executives and programme managers don't need to see every single sub-task. They need a consolidated dashboard that rolls up key metrics—like progress, budget, and status—across many different, and often unrelated, projects. This blueprint delivers exactly that.
It gives you a high-level command centre for checking the health of your entire portfolio at a glance. It’s designed to answer the big questions: "Are we on track?" and "Where are the biggest risks hiding?"
This is hands-down one of the most common and valuable ways to use Structure for Jira. It solves a fundamental weakness in native Jira by letting you pull together and compare data from completely separate projects in one unified view.
Here’s the recipe for it:
- Insert Generator: Use a broad JQL query to grab the top-level epics or initiatives from all the projects you care about. For example:
project in (PROJA, PROJB, PROJC) AND issuetype = Epic. - Formula Columns: This is where the power is. Add columns for your key metrics. A progress column could use a formula like
SUM{...}to calculate completion based on the status of all child issues. A budget column could sum up story points or logged time. - Group Transformation: Take it a step further by applying a transformation to group these projects by a custom field, like ‘Business Unit’ or ‘Strategic Goal’, for even cleaner reporting.
Team Resource Management Blueprint
Team leads and scrum masters live and breathe workload and capacity. This blueprint is for them. It organises work by assignee and sprint, giving an instant overview of who is working on what and, crucially, whether anyone is overloaded or has room for more.
It’s an amazing tool for daily stand-ups, sprint planning, and general capacity management. You can spot bottlenecks in seconds and reallocate tasks to keep the team flowing smoothly without burning anyone out.
This view is built mostly with transformations:
- Insert Generator: First, pull in all the issues for a specific team or board. A JQL query like
project = "Team X" AND Sprint in openSprints()works perfectly. - Group by Assignee Transformation: Now, apply a "Group by Assignee" transformation. Just like that, you have a list of every team member with their assigned tasks nested underneath.
- Group by Sprint Transformation: Alternatively, you could use a "Group by Sprint" transformation to see the work planned for the current sprint versus upcoming ones.
These blueprints provide a fantastic starting point. Below is a quick-reference table summarising the core components of each.
Structure Templates for Common Use Cases
This table breaks down the generators and transformations needed to build these three powerful and common structures in Jira.
| Use Case | Primary Generators | Key Transformations | Primary Business Value | | :--- | :--- | :--- | :--- | | Agile at Scale | JQL Insert, Extend with Linked Issues | Group by Sprint, Sort by Rank | Provides full traceability from strategic themes down to individual sub-tasks, ensuring alignment across the organisation. | | Portfolio Management | JQL Insert (multi-project) | Group by Project, Group by Custom Field (e.g., QBR Goal) | Aggregates data from disparate projects into a single high-level dashboard for executive oversight and risk management. | | Team Resource Planning | JQL Insert (team-specific), Stories under Epics | Group by Assignee, Group by Sprint | Offers a clear view of team workload and capacity, helping to prevent bottlenecks and burnout during sprint planning. |
By customising these recipes, you can create the exact project views your organisation needs to turn all that Jira data into clear, decisive action.
How Structure Stacks Up Against Native Jira and Other Apps
So, you're looking at your options. Is Structure for Jira the right call, or can you get by with what Jira offers out of the box? Honestly, it all comes down to the scale and complexity of your work.
If you’re managing straightforward tasks within a single project, Jira’s native features, like its basic hierarchy or even Advanced Roadmaps, will often do the trick. They’re built for that purpose, and they handle it well.
But many growing organisations eventually hit a wall. Native Jira starts to creak and groan when you try to pull together a unified view across multiple projects. It especially struggles when you need to calculate custom progress metrics that roll up from child tasks to parent epics. This is exactly where Structure steps in, offering a degree of flexibility that Jira alone just can't provide. Think of it as a powerful data aggregation and visualisation engine that sits right on top of your existing Jira instance.
Native Jira Versus Structure for Jira
Imagine native Jira is a set of pre-fabricated building blocks. It’s brilliant for standard agile frameworks, but it gets pretty rigid when your real-world processes don’t quite fit the textbook model. Structure, on the other hand, is like getting a fully customisable construction kit where you can design your own pieces.
- Jira’s Limits: Its core strength is tracking issues within a project. The moment you need to see how dependencies or progress link up across several unrelated projects, you're left building clunky dashboards and doing a lot of manual reporting.
- Structure’s Advantage: It was built to effortlessly pull data from dozens of projects into one single, dynamic, real-time view. This is a game-changer for anyone doing portfolio management or cross-team planning.
Here's the fundamental difference: Native Jira shows you what’s happening inside individual silos. Structure for Jira smashes those silos, showing you how everything connects across the entire organisation to create a single source of truth.
This capability is a huge reason why so many large enterprises adopt it. In Germany, for example, Atlassian’s revenue has climbed to $539.55 million, largely because big companies need sophisticated tools for ITSM and project management that standard Jira can’t deliver alone. You can dig into more of Jira's adoption and market data on enlyft.com.
What About Other Marketplace Apps?
The Atlassian Marketplace has plenty of great project management apps, so what makes Structure different? One of its biggest selling points is pure performance and scale. It's built from the ground up to handle massive amounts of data—we're talking hundreds of thousands of issues—without slowing to a crawl. For large-scale enterprises, that's not a luxury; it's a necessity.
Another major differentiator is its powerful formula language, S-JQL. While other apps might offer some custom fields or simple roll-up calculations, Structure lets you run complex, Excel-style formulas directly inside your hierarchies. You can calculate weighted percentages, track budgets, and flag risks based on custom logic.
Combine that flexibility with its seamless integration with its sister app, Structure.Gantt, and you have a complete project planning and visualisation suite. Few alternatives on the marketplace can match that combination of depth, performance, and customisation.
Best Practices for Implementation and Governance
Getting Structure for Jira up and running is one thing; getting it right is another. Just installing a tool this powerful isn't enough. To make it stick and see real value, you need a smart plan for how you roll it out and keep it organised.
The best way I’ve seen this work is to start small with a pilot team. Pick a single team that’s open to new things and give them a clear, focused task, like mapping out their next project in a structure.
This approach lets you learn the ropes in a low-stakes environment. You’ll get honest feedback, work out the kinks, and build a success story you can use to get other teams excited. It's far better than dropping a new tool on the entire company all at once.
Establish Clear Governance Rules
Once you're ready to expand beyond that first team, it’s time to set some ground rules. Without a solid governance plan, your neatly organised tool can quickly descend into a chaotic free-for-all, with duplicate structures and confusing naming, making it impossible to find anything.
Here are the essentials for your governance plan:
- Clear Naming Conventions: Create a simple, mandatory format for all shared structures. Something like "[Team] - [Project] - [Purpose]" works wonders. It instantly tells everyone what a structure is for without even having to open it.
- Permission Management: Be intentional about who can create, edit, and view structures. Most people only need to view them. Keep creation and editing permissions for team leads or a few trained power users to maintain quality and avoid a mess.
- Regular Clean-ups: Plan to do a bit of housekeeping every quarter. A quick review to archive old structures or delete drafts keeps everything running smoothly and makes the system easier to navigate.
A well-defined governance model is the difference between a powerful, collaborative tool and a disorganised free-for-all. It ensures that every structure adds value and contributes to organisational clarity rather than creating more noise.
Optimise for Performance
Finally, as more teams start using Structure for Jira, you need to keep an eye on performance. Nothing kills adoption faster than a tool that feels slow. A few simple habits can keep your structures snappy and responsive.
Teach your teams to use tight, specific JQL queries in their generators. A query that pulls in 50 relevant issues is always better than a broad one that fetches 5,000 and then filters them.
Also, advise against building massive, overly complex hierarchies with tons of nested levels. Flatter, more focused structures are not only faster to load but also much easier for people to understand and work with.
Your Top Questions Answered
When teams first dip their toes into Structure for Jira, a handful of questions almost always pop up. Let's tackle some of the most common ones head-on.
Can Structure Actually Handle a Massive Jira Instance?
Absolutely. This is one of the main reasons so many large organisations rely on it. Structure was built from the ground up to perform at scale.
We're not just talking about a few thousand issues. It's engineered to manage hundreds of thousands of them without grinding to a halt. This high performance is a real game-changer compared to other apps or even some of Jira's native reporting features when you're dealing with enterprise-level data.
How Well Does It Play with Other Tools?
Structure integrates beautifully with other apps, especially those from the same family, like Structure.Gantt. Combining the two lets you instantly turn your carefully organised hierarchies into dynamic Gantt charts, which is brilliant for visual timeline planning and dependency tracking.
Beyond that, it's flexible enough to pull in data from custom fields created by other Marketplace apps. This means you can build a truly centralised view of your projects, incorporating information from all corners of your Atlassian suite.
Is This Just for Agile Teams?
Not in the slightest. While it's a powerhouse for scaling agile frameworks like SAFe, that's just one of its many uses. Its real strength lies in its flexibility.
We’ve seen it used by traditional waterfall project managers to map out phases and deliverables, marketing teams to track complex campaigns, and even IT operations teams to organise support tickets. Because you can build any hierarchy you can imagine, you can make it fit whatever workflow or organisational style your team uses.
Ready to transform your Jira data into actionable insights? With Acquispect, we help you build the trust layer for the digital economy, proving skills, not just listing them. Discover how we can bring clarity to your talent and project management. Learn more at Acquispect.